DAR
In reply to the above rebuttal to my
letter (top of thread). I don't know this person but since they are a
republican apologist I'll use the name tag "REP."
****
REP
1)
Stock market. Four of the five top Presidents for stock market growth
are Republicans. The only democrat in the top 5 is Clinton.
DAR
That's nice, but you forgot to bring along any evidence whatsoever
for your assertion. I have provided multiple lines of evidence showing
otherwise and have others I didn't include due to space. You provide a
mere assertion.
REP
All that growth happened during the years
republicans ran Congress (500 point on the DOW the first two years,
7000 points the last six...feel free to look that up).
DAR
Why? It's not relevant to my thesis which is that these seven or so
variables had better results under Democratic Presidents. What happened
under the various Congressional rule is an interesting question and one
worth exploring but it does not address my claim (except my #3 which
refutes your unsupported claim).
REP
Those exact policies
were free trade, balanced budget, and a tax decrease. All republican
issues, and none of those are supported by Obama or the Dems today). So,
looking at YOUR data, I see the stock market as better under
Republicans.
DAR
I am not interested in what you can "see"
but in what you can show, and your #1 shows nothing because it contains
nothing beyond mere assertion.
REP
2) Economic growth. First the citation used includes Hoover, which I think is a stretch.
DAR
If you read my citation carefully you would know that the numbers for
"investment growth" (not "economic growth") were also calculated with
Hoover removed and the Demo's still performed 6x better.
REP
As I pointed out I believe Clinton's last six years, based on enacted
policies, were Republican Congress policies not Presidential preference
policies.
DAR
You may wish to believe that but it does not address my thesis which is an examination of a comparison of presidents.
REP
Under those circumstances (using your data) the Republicans, since 1968 would come out better.
DAR
Show this. Since you don't even state my #2 correctly I am not confident you have looked at this one carefully.
REP
Again I would point out what POLICIES caused economic growth. The only
democratic growth that is above average in the last 40 years (again, by
your citations) comes during the Clinton years. As for GDP growth I see
it better off under Republican policies.
DAR
In my #4
reference I have provided evidence showing GDP growth has been better
Democratic Presidents. This is an objective claim that can be measured
and shown to be true or false. Again, the claim was, with regard to
Presidents:
"American Gross Domestic Product has grown nearly three times as fast under Democrats as Republicans."
The data shows this is clearly true but rather than admit this you want
to give credit to some undefined and unmeasurable category of
"republican policies." This does not address my claim and curiously you
don't even attempt to support your claim. And it's not clear you
understood the claim of my #2. Perhaps read it again. It refers
specifically to "investment growth."
REP
3) Deficits. Based upon the data cited in the OP there is no way to tell. They used real dollars, not adjusted for inflation.
DAR
Inflation happens in all presidential terms. The rate goes up, the
rate goes down. I have provided evidence showing that the average annual
republican deficit is four times larger than under Democratic
Presidents. The idea that this difference can be made up by a difference
in inflation, is laughable.
REP
That clearly is NOT the way to measure this metric.
DAR
Show this.
REP
During WWII (under a Dem) the deficit was 44% of GDP. Clearly MUCH
bigger than it is right now as a percentage, but a small amount in
dollars as compared to right now.
DAR
Then the large
deficits of that time period should have really hurt the average annual
deficit numbers for the Democrats. Curiously you want special
consideration for Hoover but want Democrats to be credited with the cost
of WWII! And that's okay, because Reagan/Bush spent so much (and
Clinton paid down the debt) the republicans still end up the far bigger
spenders. To avoid dealing with this bad result the constant dollar
measurement provides you appeal to inflation. When that doesn't work you
want to calculate the deficit relative to GDP. I remember when
Republicans used to hate that trick.
This may be useful here:
http://traxel.com/deficit/deficit-perce ... -years.pngREP
4)
Job creation. "James Carville put it this way: "In the last fifty
years, there have been ten Presidents--five Democrats and five
Republicans--and the Democrats place first, second, third, fourth and
fifth [in new job creation]… the chance of that occurring randomly is 1
in 252…”" James Carville must have gone to public school, because he's
horrible at math. If you have 10 random events (coin tosses, President
party affiliations), there is a 1 in 32, still not bad, but the data is
skewed.
DAR
If you are going to insult someone's math
abilities and where they may have attended school it's best to have your
numbers straight. You don't. Simply put, Carville is right, you're
wrong (note the title of his book!). Perhaps your private school tuition
could have been better spent elsewhere. If "you have 10 random events"
or "coin tosses" as you say, this gives you odds of one in 252. Five
gives you 1 in 32.
But this is incidental and a distraction from my
point which is in fact true, the presidents with the top job growth
numbers have been Democrats.
REP
That statement was made
in 1996. It would have included Truman years and years that included the
draft during a world war, and the draft during Kennedy and Johnson for
Viet Nam. I can only assume (since there is no data cited) that he is
including draft data in his "jobs" number. I think this counts as a
"null" since the numbers cannot be verified.
DAR
The Nobel
Prize winning Krugman does a comparison similar to Carville's except it
is from July. Perhaps this is a chart from his book. Demo's hold the top
four spots. GW Bush, is of course last.
http://krugman.blogs.nytimes.com/2008/0 ... talking-2/This is better:
"The Simple Arithmetic of Employment: Job Growth Is Always Higher When a Democrat Is In The White House"
http://www.huffingtonpost.com/david-fid ... 24510.htmlAn excerpt:
"Remember
the last time the number of jobs grew more rapidly under an Republican
president? John McCain can't. Because he wasn't born yet. Over the past
75 years, one trend has held constant. Rapid job growth only occurs when
there's a Democrat in The White House.
No Republican President
-- not Eisenhower, not Nixon, not Reagan, not Bush -- has ever created
more jobs, or created jobs at a faster rate, than his Democratic
predecessor. It's not even close. The contrast has been especially stark
over the past 16 years, when 23.1 million jobs were created under
Clinton and less than 5 million were created under Bush. On average, job
growth under Democrats is more than twice that under Republicans.
Whatever
benchmark you use, the difference is dramatic. Since Truman was elected
in 1948, 53.2 million new jobs were created during the 24 years when
Democrats held The White House, and 38.3 million were created during the
36 years of Republican administrations."
--Source: The Bureau of Labor Statistics, seasonally adjusted non-farm payrolls.
DAR
This
fellow examines the last 13 presidents. He also examines the record
during Congress. Democratic Presidents hold the top six slots.
http://www.laprogressive.com/2008/08/08 ... idents-do/REP
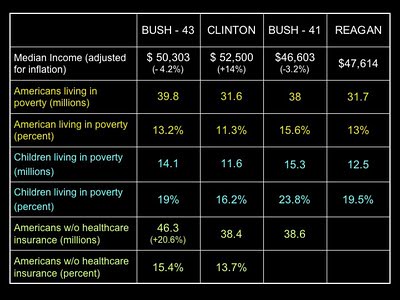
5) Poverty. I see how they are analyzing the numbers, and I challenge it.
DAR
Finally, a challenge!
REP
There were minute drops under several Democratic Presidents and minute increases under Republicans.
DAR
Well you gave up that challenge rather quick. I'll take it.
REP
But if you look at the AVERAGE rate you will see a serious difference.
GWB is slightly better than Clinton, who is slightly better than Reagan.
But the HUGE difference is under Kennedy, where the poverty rate is
double that of almost any other President since him. If you look back as
far as this data goes (Kennedy) and ask "who had the highest poverty?"
it would be Kennedy, then Johnson, with GWB coming in the lowest. I
would also suggest that under FDR, or Truman the poverty would
skyrocket. Based on this analysis I would give the Republicans the
better score.
DAR
Of course you would. But none of this refutes or even addresses my claim, which is specifically:
"With
the exception of president Nixon, poverty went up under every
Republican president since 1961. Under every Democratic president since
1961, it fell." Address the claim, don't change it.
REP
6) Spending. This is where I believe the President has less influence than Congress.
DAR
That's nice. Perhaps in my next letter I will examine the record of
Congress. This letter is addressing the record of US Presidents.
REP
I will add one additional data point here;
http://carriedaway.blogs.com/carried_aw ... %20GDP.GIFIf
you look at the chart you will see that the ONLY significant time since
1977 that the congress slowed down their spending was when the
Republicans took over Congress in 1994.
DAR
Reagan didn't sign those spending bills? Amazing. Did Reagan ever submit a balanced budget?
Let's ask leftwinger Joe Scarborough (just kidding, he's a rightwing
conservative Republican) to do some comparisons. This from his 2004
book:
"The White House's own numbers best illustrate how
shamefully the Party of Reagan has misspent our tax
dollars over the last ten years. When comparing its
fiscal record to that of the Clinton administration,
George W. Bush's White House loses in a landslide."
-- Republican Joe Scarborough, "Rome Wasn't Burnt in a Day, pg. 27
"Using the Bush White House's own numbers, the federal
government under Bill Clinton grew at an annual rate
of 3.4 percent. But over the past four years under
George W. Bush and his Republican Congress, the
federal government has grown at a staggering rate of
10.4 percent. More damning is the fact that... George
Bush never once vetoed a congressional bill." --Republican Joe Scarborough, "Rome Wasn't Burnt in a Day”, pg. 29
REP
<Snip>
In this case I find the point a draw, since the Republican Congress
went astray in the last six years of its existence.
DAR
The point "is a draw" because the Republicans did what I claim they do? Again, amazing.
Here is a very interesting chart:

And
he notes: "Interestingly, since Johnson, every Democrat has increased
revenue more than spending. However in the opposite case, under all
five Republican Presidents, since Nixon, government revenue has
decreased and spending has increased."
I must keep this link, he makes my case over and over:
http://www.cedarcomm.com/~stevelm1/usdebt.htmREP
So, where does this leave us? The six points of the article and how I look at the EXACT same data (with some addition for #6).
1) stock market. False
2) GDP growth. False
3) larger deficits. Cant Tell
4) job creation. Cant Tell
DAR
You forgot to provide a drop of evidence for #1. You completely
changed the subject on #2. As I have shown the Republican deficits are
twice as large in constant dollars without even considering Bush II
(#3). Krugman supports my job creation claim so we actually "can tell"
and, unlike your near complete lack of references I provide two more and
have several other sources supporting this claim as well.
REP
5) poverty. False
DAR
You already conceded #5 is true. Your words: "There were minute drops
under several Democratic Presidents and minute increases under
Republicans."
REP
6) Federal spending. Draw
DAR
I
provide data showing Republican spending is almost double, you
provide... "the Republican Congress went astray." Well yes they did, and
that is the point in question isn't it? Where I went to public school,
that wasn't a draw. Maybe your private schools operated differently?
Another useful chart on federal spending:
 ibid
ibidREP
So,
as I said earlier, the entire premiss revolves around those six things
are better under Democratic Presidents. Looking at the SAME data, I come
to completely different conclusions. Thus I declare your premiss denied
(QED).
DAR
That's a little premature to say the least.
When you did address the actual premise, you didn't support your
conclusions. Almost without exception you provide no references
supporting your claims and most of the time you stray from engaging my
actual claim. Maybe you will try again. I hope so. And do remember the
premise which is that these categories are better under Democratic
presidents. Appeals to Congressional records would be interesting (see
my footnote #3 which addresses this) but not relevant to this actual
premise.
regards,
Darrel


